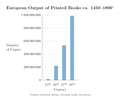
دوتنه:European Output of Books 500–1800.png

Page contents not supported in other languages.
د ويکيسيند لخوا

اصلي دوتنه(۱٬۴۳۶ × ۹۵۳ پېکسل, د دوتنې کچه: ۶۴ کيلوبايټ, MIME بڼه: image/png)

دا دوتنه د ويکيمېډيا کامنز لخوا خپرېږې او کېدای شي چې دا په نورو پروژو هم کارېدلې وي. د دوتنې د کارېدنې لا نور مالومات د دوتنې د څرگندنو په مخ کې لاندې ښودل شوی.

لنډيز

څرگندونه
Deutsch: Geschätzte europäische Buchproduktion von 500 bis 1800. Bei den Manuskripten sind einzelne Urkunden und Chartas nicht berücksichtigt. Ein gedrucktes Buch ist definiert als ein Druckwerk von mehr als 49 Seiten.
English: Estimated European output of books from 500 to 1800. Manuscripts do not include individual deeds and charters. A printed book is defined as printed matter containing more than 49 pages.
نېټه
سرچينه

شخصي اثر

Data from: Buringh, Eltjo; van Zanden, Jan Luiten: "Charting the “Rise of the West”: Manuscripts and Printed Books in Europe, A Long-Term Perspective from the Sixth through Eighteenth Centuries", The Journal of Economic History, Vol. 69, No. 2 (2009), pp. 409–445 (416–417, tables 1&2)
ليکوال Tentotwo
نورې بڼې
This graph image could be re-created using vector graphics as an SVG file. This has several advantages; see Commons:Media for cleanup for more information. If an SVG form of this image is available, please upload it and afterwards replace this template with {{vector version available|new image name}}.


It is recommended to name the SVG file “European Output of Books 500–1800.svg”—then the template Vector version available (or Vva) does not need the new image name parameter.

LaTeX source

\documentclass[border=5mm]{standalone}
\usepackage{pgfplots}
\usepackage[super]{nth}
\usepackage{amsmath}
 
 
\pgfplotstableread{
Siglos Manuscritos Libros impresos
6       13552           nan
7       10639           nan
8       43702           nan
9       201742  nan
10      135637  nan
11      212030  nan
12      768721  nan
13      1761951 nan
14      2746951 nan
%15   4999161 12589000
16       nan            217444000
17      nan             531941000
18      nan             983874000
}\datatable
 
\definecolor{RYB1}{RGB}{128, 177, 211}
\definecolor{RYB2}{RGB}{253, 180, 98}
 
\begin{document}
\begin{tikzpicture}
\begin{semilogyaxis}[
        axis on top=false, grid=both, xmajorgrids=false, every minor grid/.style=gray!20,
        axis lines*=left,
        width=12cm, height=8cm, enlarge x limits=0.05,
        ymin=1000, ymax=1e9,ytick={1000,1e4, 1e5, 1e6, 1e7, 1e8, 1e9},
        yticklabels={1000, 10\,000, 100\,000, 1\,000\,000, 10\,000\,000, 100\,000\,000, 1\,000\,000\,000},
        enlarge y limits=false,
        ybar=-10pt, xtick={6,...,18}, xticklabel={\pgfmathparse{int(\tick)}\nth{\pgfmathresult}},
        xlabel=Siglos, xlabel style={yshift=-1ex},ylabel=Número\\ de Copias,
        ylabel style={rotate=-90, align=left, anchor=east, xshift=-4ex, name=ylabel},
        after end axis/.code={
                \node [
                        font=\large\bfseries,
                        text=RYB2!60!black, fill=white, fill opacity=0.85, text opacity=1,
                        anchor=center, inner xsep=1pt]  at (axis cs:11,5e3) {Manuscritos};
                \node [
                        font=\large\bfseries, inner xsep=1pt,
                        text=RYB1!60!black,
                        fill=white, fill opacity=0.85, text opacity=1,
                        align=center, anchor=center]  at (axis cs:16.6,5e3) {Libros impresos};\
        },
        title={Producción Europea occidental de libros entre los años 500 y 1800$^{\text{\tiny{*}}}$},
        title style={font=\large\bfseries, align=center}
        ]
 
        \addplot +[fill=RYB1, draw=RYB1!50!black] table [y=Books] {\datatable};
        \addplot +[fill=RYB1, draw=RYB1!50!black, /pgf/bar shift=2.5pt] coordinates {(15,12589000)};
        \addplot +[fill=RYB2, draw=RYB2!50!black] table {\datatable};
        \addplot +[fill=RYB2, draw=RYB2!50!black, /pgf/bar shift=-2.5pt] coordinates {(15,4999161)};
        \draw (rel axis cs:0,0) -- (rel axis cs:1,0);                 
\end{semilogyaxis}
\node (annotation) at (current axis.below south west) [inner xsep=0pt, anchor=north west, align=left, font=\tiny] {$^*$without Southeast Europe (Byzantine, later Ottoman realm) and Russia};
 
\end{tikzpicture}
\end{document}

منښتليک:

زه، د دې اثر د خپرولو او لمېسلو خاوند، دا دوتنه د لاندې منښتليک پر بنسټ دلته خپروم:
w:ps:کريېټيو کامانز
اړوندېدنه يوشان شريکول
دا دوتنه د کريټيف کامنز Attribution-Share Alike 3.0 Unported په منښتليک سمبال ده.
تاسې کولی شئ چې:
  • بيا يې د نورو سره شريک کړئ – همدا اثر ولمېسئ، و وېشئ او بيا يې خپور کړئ
  • بيا ادلون بدلون راولئ – بدل شوی اثر خپل کړئ
د لاندې شرطونو له مخې:
  • اړوندېدنه – تاسې بايد دا اثر د ليکوال يا منښتگر لخوا د ځانگړو شويو اصولو سره اړونده وگڼئ (خو په دې توگه نه چې داسې ښکاره شي چې گنې تاسې يا ستاسې لخوا کارېدنه د اثر د ملاتړ سبب شوی)
  • يوشان شريکول – که تاسې همدا اثر بدلوئ، رغوئ، او يا يې هم سر له نوي جوړوئ نو په پايله کې رامېنځ ته شوی اثر به يوازې د همدې دوتنې ورته منښتليک پر بنسټ خپروئ.

Captions

Add a one-line explanation of what this file represents

Items portrayed in this file

depicts انګليسي

copyright status انګليسي

copyrighted انګليسي

source of file انګليسي

۱۵ ډيسمبر 2011

د دوتنې پېښليک

په يوې نېټې/يوه وخت وټوکۍ چې د هماغه وخت او نېټې دوتنه چې څنگه ښکارېده هماغسې درښکاره شي.

نېټه/وختبټنوکډډېکارنتبصره
اوسنی۰۲:۴۱, ۲۲ ډيسمبر ۲۰۱۱د ۰۲:۴۱, ۲۲ ډيسمبر ۲۰۱۱ پورې د بټنوک بڼه۱٬۴۳۶ × ۹۵۳ (۶۴ کيلوبايټ)TentotwoRemoved source text from image
۰۳:۵۳, ۱۶ ډيسمبر ۲۰۱۱د ۰۳:۵۳, ۱۶ ډيسمبر ۲۰۱۱ پورې د بټنوک بڼه۱٬۴۵۵ × ۹۵۳ (۷۳ کيلوبايټ)TentotwoImproved formatting
۰۰:۳۸, ۱۵ ډيسمبر ۲۰۱۱د ۰۰:۳۸, ۱۵ ډيسمبر ۲۰۱۱ پورې د بټنوک بڼه۱٬۲۶۰ × ۷۹۹ (۸۷ کيلوبايټ)Tentotwo

داسې هېڅ کوم مخ نه شته چې د دغې دوتنې سره تړنې ولري.

د نړېوالې دوتنې کارېدنه

همدا دوتنه لاندينۍ نورې ويکي گانې کاروي: